An old friend called me the other day and while catching up, we got onto the subject of investing.
With all the uncertainty in the world, with artificial intelligence and large language models constantly evolving, and with market valuations as high as they are… what’s an investor to do? Where should we be putting our money?
You can make a case for almost anything. The market is overvalued and so buying the S&P 500 when the Shiller PE Ratio is at 40 feels insane. The mean ratio is around 17. But the market has been performing well! And has performed well even at such lofty ratio levels!
Add to that how AI and LLMs are upending the world. I do not envy the position high schoolers are in right now when deciding what to do with their lives. Law and coding do not seem like fields where you will have a good time as an entry level employee.
While it feels uncertain, one thing that we forget is that the future is always uncertain.
The market is overvalued? Invest anyway.
The economy looks weak? Invest anyway.
AI is taking over? Invest anyway.
But you must take action in spite of that uncertainty.
We won’t know what the stock market will do in the next week. Or month. Or year. The Fed will make it’s decisions, the markets will react, and maybe we will enter a recession. Maybe not. The media has been talking about a recession for two or three years, but it has yet to materialize. Or impact the stock the market.
But in the long run, we believe it’ll go up.
Which is why it’s still smart to make contributions to your retirement, even if the PE ratios are insane.
To hammer this home, I want to show you two charts:
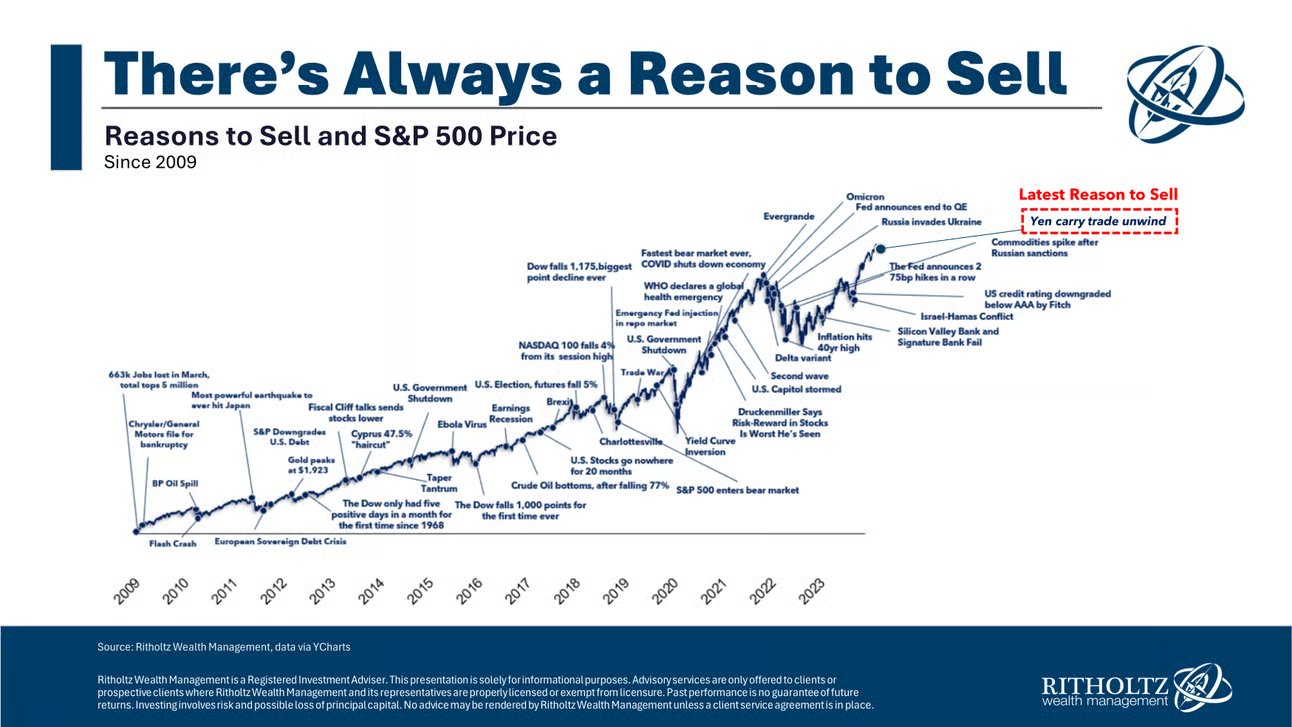
First, there’s always a reason to sell. (Or not buy.)
It comes from Ritholtz Wealth Management and shows how historically there’s always a reason to sell your stocks. Bad jobs numbers. Fear of recession. Pandemic. It’s a non-stop stream of bad news. And, honestly, it’s quite compelling.
There are bumps along the way. Sometimes big ones. But notice the S&P 500 chugs along up and to the right.
This next chart comes from A Wealth of Common Sense and shows the return of the market over different time horizons. It shows your annual rate of return based on when you started investing (the column) and how long you waited (the row):
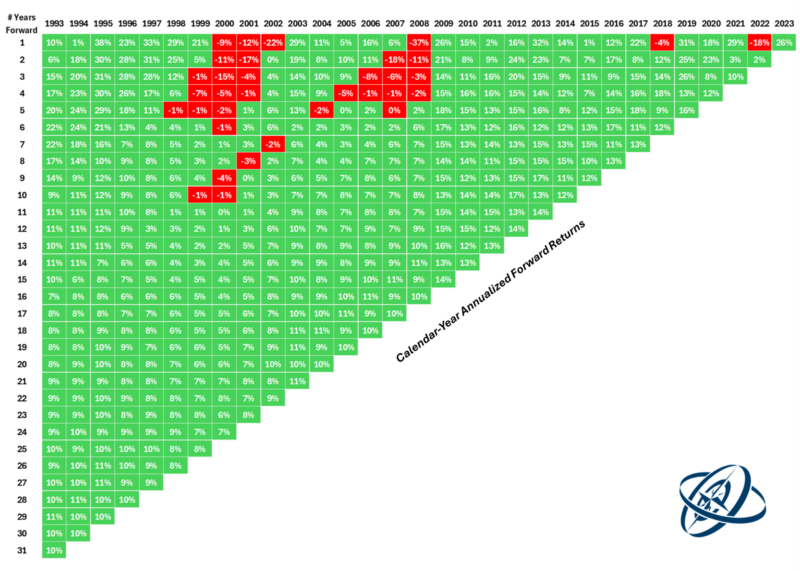
If you invested in 2000, you had negative annualized returns for six years before turning positive. If you invested in 2008, you had four years of negative returns before turning positive. Those are big bumps.
But the table is overwhelmingly green. And the red chunks are during periods of massive upheaval – the dot com bubble and the Great Recession. The pandemic hardly registers a blip!
Now may not be the best time to invest in the stock market. Maybe you should wait until near year. Or the year after. Or go into real estate. Or crypto. But there’s always a reason why it’s not the best time.
Or maybe you should invest today and check your account balance in twenty years.
If you wait long enough, it’ll look like a good decision.
Invest anyway.
Other Posts You May Enjoy:
2026 Retirement Contribution Limits & Income Phaseouts Updated by IRS
Earlier this month, the IRS released the 2026 contribution limits for a variety of retirement accounts and despite their best efforts, it’s formatted like an encyclopedia. Here are the limits organized in a way that is more readable.
How to Remove Your Personal Information from Data Brokers
Scammers and marketers can easily find your data online. Here’s a step-by-step weekend project to remove yourself from major data brokers – with direct opt-out links.
How to get free access to museums
If you would like more culture in your life, did you know you can do so on the cheap? There are numerous culture and museum pass programs offered by libraries across the nation.
What States Collect Sales Tax When Buying Costco Gold
It was big news when Costco started selling gold bars, but did you know that only a handful of states collect sales tax on it? Here’s where you will and won’t pay tax on your purchase.

About Jim Wang
Jim Wang is a forty-something father of four who is a frequent contributor to Forbes and Vanguard’s Blog. He has also been fortunate to have appeared in the New York Times, Baltimore Sun, Entrepreneur, and Marketplace Money.
Jim has a B.S. in Computer Science and Economics from Carnegie Mellon University, an M.S. in Information Technology – Software Engineering from Carnegie Mellon University, as well as a Masters in Business Administration from Johns Hopkins University. His approach to personal finance is that of an engineer, breaking down complex subjects into bite-sized easily understood concepts that you can use in your daily life.
One of his favorite tools (here’s my treasure chest of tools, everything I use) is Empower Personal Dashboard, which enables him to manage his finances in just 15-minutes each month. They also offer financial planning, such as a Retirement Planning Tool that can tell you if you’re on track to retire when you want. It’s free.
Opinions expressed here are the author’s alone, not those of any bank or financial institution. This content has not been reviewed, approved or otherwise endorsed by any of these entities.